
Custom Reporting & Analytics Dashboards
-
0 sales
- 289 views
- Save
0 /5.0
User review

Overview
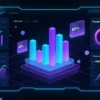
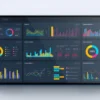
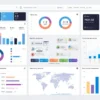
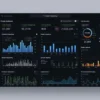
We help organizations implement Custom Reporting & Analytics Dashboards to consolidate, visualize, and analyze business data in real-time. By providing tailored dashboards and reports, businesses can monitor performance, track KPIs, and make informed decisions quickly.
Objectives
-
Centralize data from multiple sources (CRM, marketing automation, e-commerce, analytics platforms)
-
Provide real-time insights into business performance, customer behavior, and campaign effectiveness
-
Enable customizable dashboards tailored to user roles and responsibilities
-
Support data-driven decision-making across teams
-
Automate reporting workflows to save time and reduce manual errors
Key Services
1. Requirements Analysis & Planning
-
Identify key stakeholders and reporting needs
-
Define KPIs, metrics, and data sources for dashboards and reports
-
Determine user roles, permissions, and access levels
-
Map data sources, integrations, and reporting frequency
2. Dashboard Design & Development
-
Design interactive, visually intuitive dashboards with charts, graphs, and tables
-
Implement role-specific views and drill-down capabilities
-
Ensure responsive dashboards accessible across devices
-
Apply best practices for data visualization and UX
3. Data Integration & Automation
-
Connect dashboards to multiple data sources (CRM, marketing platforms, ERP, databases)
-
Automate data extraction, transformation, and loading (ETL)
-
Implement real-time data synchronization for up-to-date insights
-
Ensure data accuracy, consistency, and compliance with security standards
4. Testing & Quality Assurance
-
Validate data accuracy, visualization correctness, and functionality
-
Test dashboard performance under varying loads
-
Conduct user acceptance testing (UAT) with stakeholders
-
Refine dashboards and reports based on feedback
5. Monitoring & Maintenance
-
Monitor data feeds, dashboard performance, and system reliability
-
Provide ongoing support for updates, enhancements, and additional metrics
-
Document dashboard functionality, data sources, and maintenance procedures
Optional Advanced Features
-
Predictive analytics and trend forecasting
-
AI-driven insights and anomaly detection
-
Interactive filtering, segmentation, and drill-down capabilities
-
Integration with alerting systems for real-time notifications
-
Scheduled automated reports delivered via email or integrated systems
Ideal Use Cases
| Scenario | Benefit |
|---|---|
| Sales & Revenue Analysis | Track pipeline performance, revenue trends, and sales KPIs |
| Marketing Performance | Monitor campaign metrics, engagement, and ROI |
| Customer Insights | Understand customer behavior, segmentation, and lifecycle stages |
| E-commerce | Analyze inventory, orders, and sales data in real-time |
| Executive Reporting | Provide high-level dashboards for leadership decision-making |
Additional services
-
0 $
-
0 $
-
0 $
-
0 $
-
0 $