
Live-Data Dashboards & Reporting Modules
-
0 sales
- 283 views
- Save
0 /5.0
User review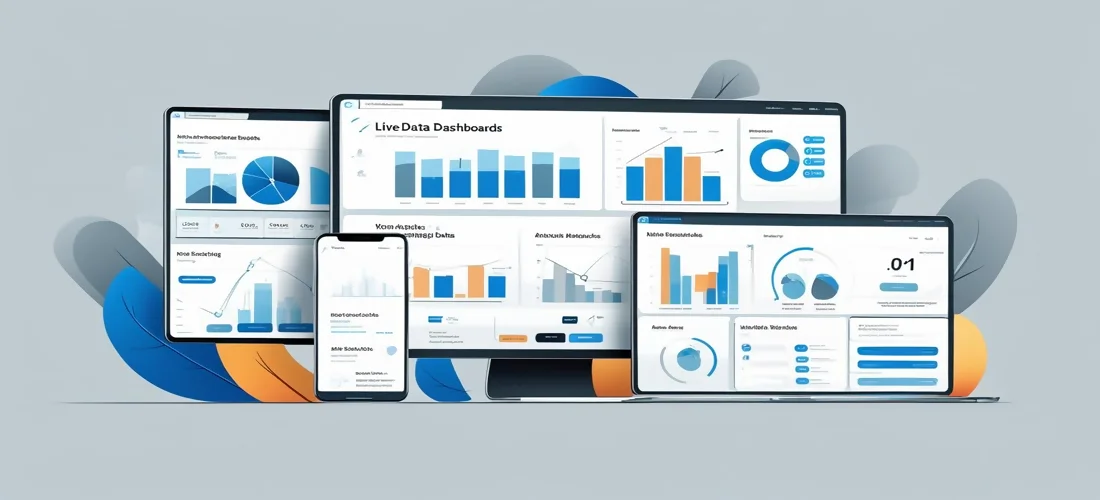





Overview
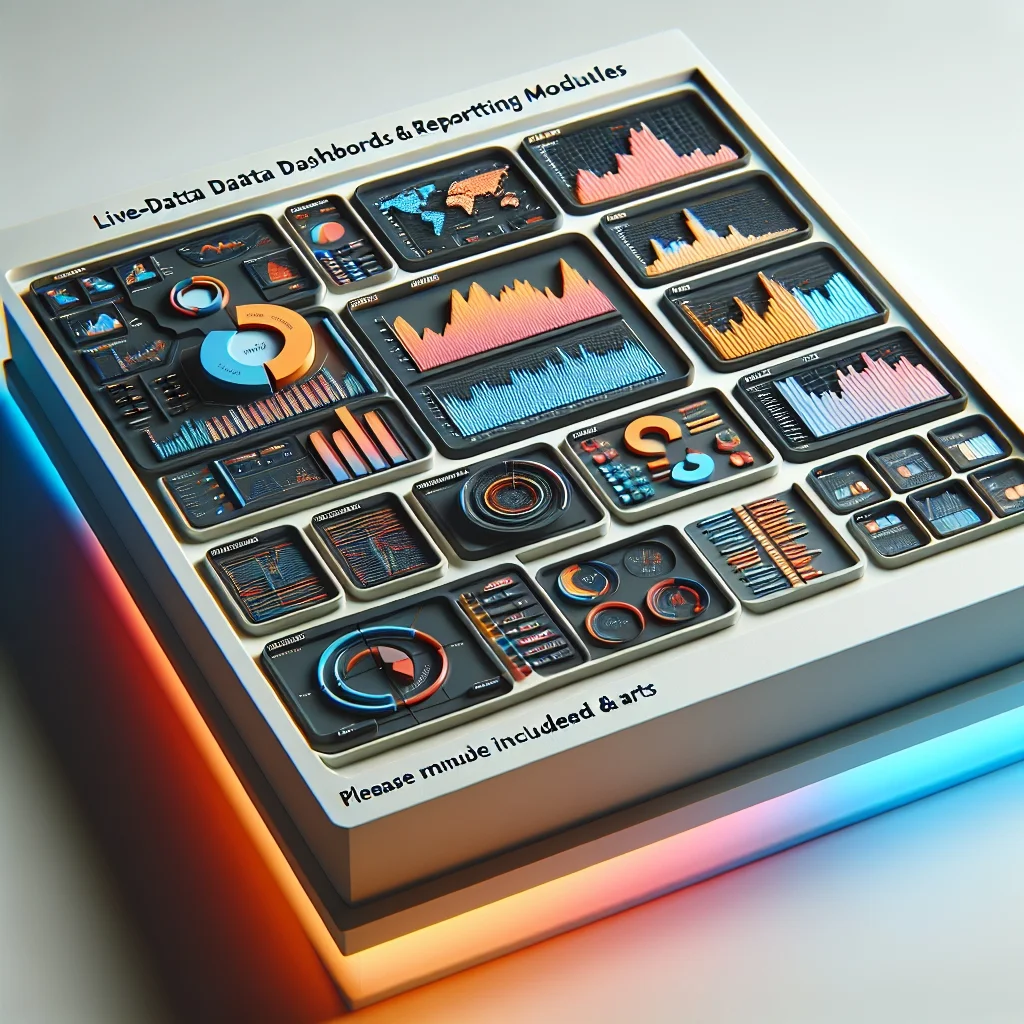
We design and build Live-Data Dashboards and Reporting Modules that provide teams with real-time visibility into their most critical metrics. By connecting directly to your data sources, we create centralized, interactive reporting tools that support data-driven decisions across marketing, sales, operations, finance, and more.
Objectives
-
Deliver real-time visibility into KPIs, metrics, and trends
-
Enable self-service data access for non-technical teams
-
Consolidate data from multiple sources into a single view
-
Automate reporting processes and reduce manual effort
-
Empower faster, more informed decision-making
Key Services
1. Discovery & Requirements Gathering
-
Identify core metrics and KPIs per department or use case
-
Audit existing reporting workflows and tools
-
Define user roles and permission levels (executives, managers, analysts)
-
Document data sources, update frequency, and transformation needs
-
Establish business logic and thresholds for alerts/indicators
2. Dashboard UX/UI Design
-
Design user-friendly, mobile-responsive dashboards
-
Visual best practices for clarity, readability, and usability
-
Custom themes and branding to match your visual identity
-
Design variations by role (e.g., CEO overview vs. team lead detail)
-
Support for data exploration (filters, drill-downs, comparisons)
3. Data Integration & Engineering
-
Connect to structured and unstructured data sources:
-
Databases: MySQL, PostgreSQL, MongoDB, SQL Server
-
Cloud Warehouses: BigQuery, Snowflake, Redshift, Azure Synapse
-
APIs: Google Analytics, Stripe, HubSpot, Salesforce, Shopify, etc.
-
Files & Streams: CSV, JSON, Excel, real-time event streams
-
-
Implement ETL/ELT pipelines for data transformation and modeling
-
Build data caching and refresh strategies (real-time, hourly, daily)
-
Set up secure authentication and user-level access controls
4. Dashboard Development
-
Build dynamic dashboards tailored to your team’s needs:
-
Real-time KPI tracking panels
-
Sales funnels, revenue dashboards, and conversion metrics
-
Marketing attribution, campaign performance, and ROI dashboards
-
Operational and logistical dashboards (e.g., inventory, delivery)
-
Customer support and engagement dashboards
-
-
Interactive features:
-
Filtering by time range, user segment, region, etc.
-
Drill-downs and click-throughs
-
Forecasting and trend analysis
-
Custom alerts and visual indicators (e.g., red/yellow/green)
-
5. Reporting Module Setup
-
Generate scheduled or on-demand reports (PDF, CSV, email exports)
-
Create custom report templates for different stakeholders
-
Embed reports into intranets, CRMs, or mobile apps
-
Automate recurring reports for key stakeholders
-
Include context layers: commentary, goal comparisons, annotations
6. Testing, QA & Rollout
-
Validate data accuracy and sync intervals
-
Conduct user acceptance testing (UAT) with key stakeholders
-
Performance optimization for large datasets or high-frequency updates
-
Train internal users on using and maintaining dashboards
Optional Advanced Features
-
Role-Based Dashboards: Personalized metrics for each user type
-
Predictive Analytics: Show future trends based on current data
-
AI/ML Integration: Smart alerts, anomaly detection, auto-insights
-
Embedded Dashboards: Integrate into customer-facing portals or SaaS products
-
Voice & Chatbot Interfaces: Query dashboards via Slack, Teams, or voice assistants
-
Data Governance Layer: Track data lineage and ensure compliance
Ideal Use Cases
| Scenario | Benefit |
|---|---|
| Sales Teams | Real-time visibility into pipeline, revenue, and performance |
| Marketing | Monitor campaign ROI, acquisition cost, and lead conversion |
| Finance | Track spend, forecasts, burn rate, and profitability metrics |
| Customer Success | Monitor NPS, ticket resolution times, churn risk |
| Executive Teams | Company-wide KPIs and OKR alignment at a glance |
Additional services
-
0 $
-
0 $
-
0 $
-
0 $
-
0 $