
Custom Dashboard Reporting
-
0 sales
- 291 views
- Save
0 /5.0
User review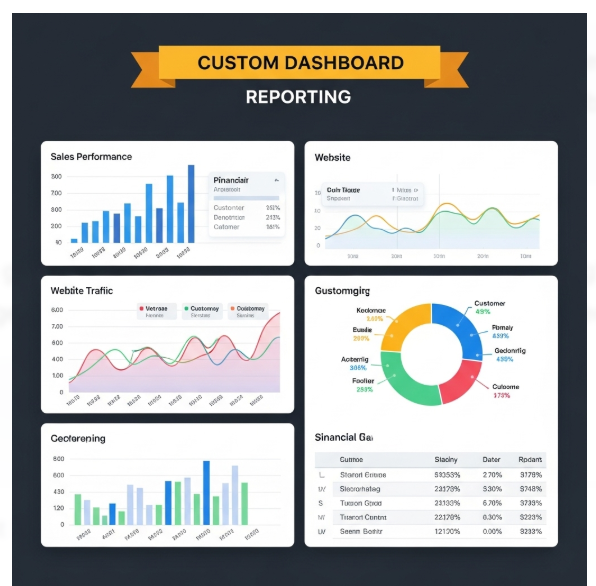


Custom Dashboard Reporting
1. Data Integration
- Connect CRM, marketing automation, sales, support, and finance systems.
- Stream real-time or scheduled data syncs via APIs or ETL pipelines.
- Normalize datasets for consistent reporting across sources.
2. Metric Definition
- Define KPIs by department (sales pipeline, marketing ROI, churn rate, NPS).
- Map metrics to business goals (revenue, retention, engagement).
- Standardize calculation rules for consistency across dashboards.
3. Dashboard Design
- Build modular dashboards (executive, sales, marketing, customer success).
- Enable drill-down views (from high-level KPIs to transaction-level detail).
- Support role-based customization (different views per team/user).
4. Visualization & Automation
- Use dynamic visualizations (heatmaps, funnel charts, trend lines).
- Automate alerts for threshold breaches (e.g., drop in conversion rate).
- Provide filters for date ranges, segments, and campaigns.
5. Distribution & Access
- Embed dashboards inside CRM or BI tools (Tableau, Power BI, Looker).
- Automate scheduled reports via email/Slack with snapshot KPIs.
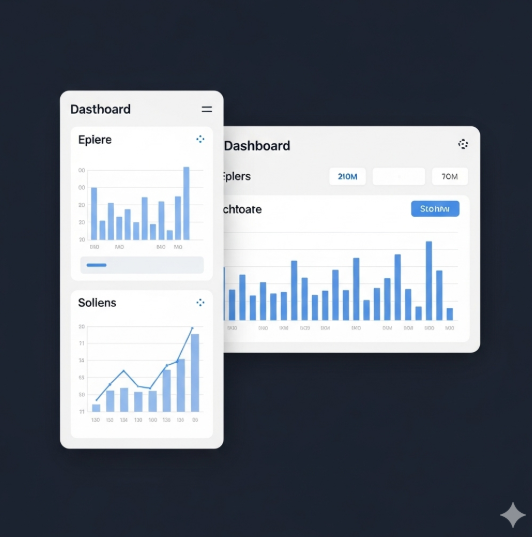
- Enable mobile-optimized dashboard access for on-the-go insights.
6. Continuous Improvement
- Collect user feedback on dashboard usability.
- Add new metrics as business evolves.
- Maintain version control for report templates.
Additional services
-
0 $
-
0 $
-
0 $
-
0 $
-
0 $